Analytics and Performance Tracking
Overview
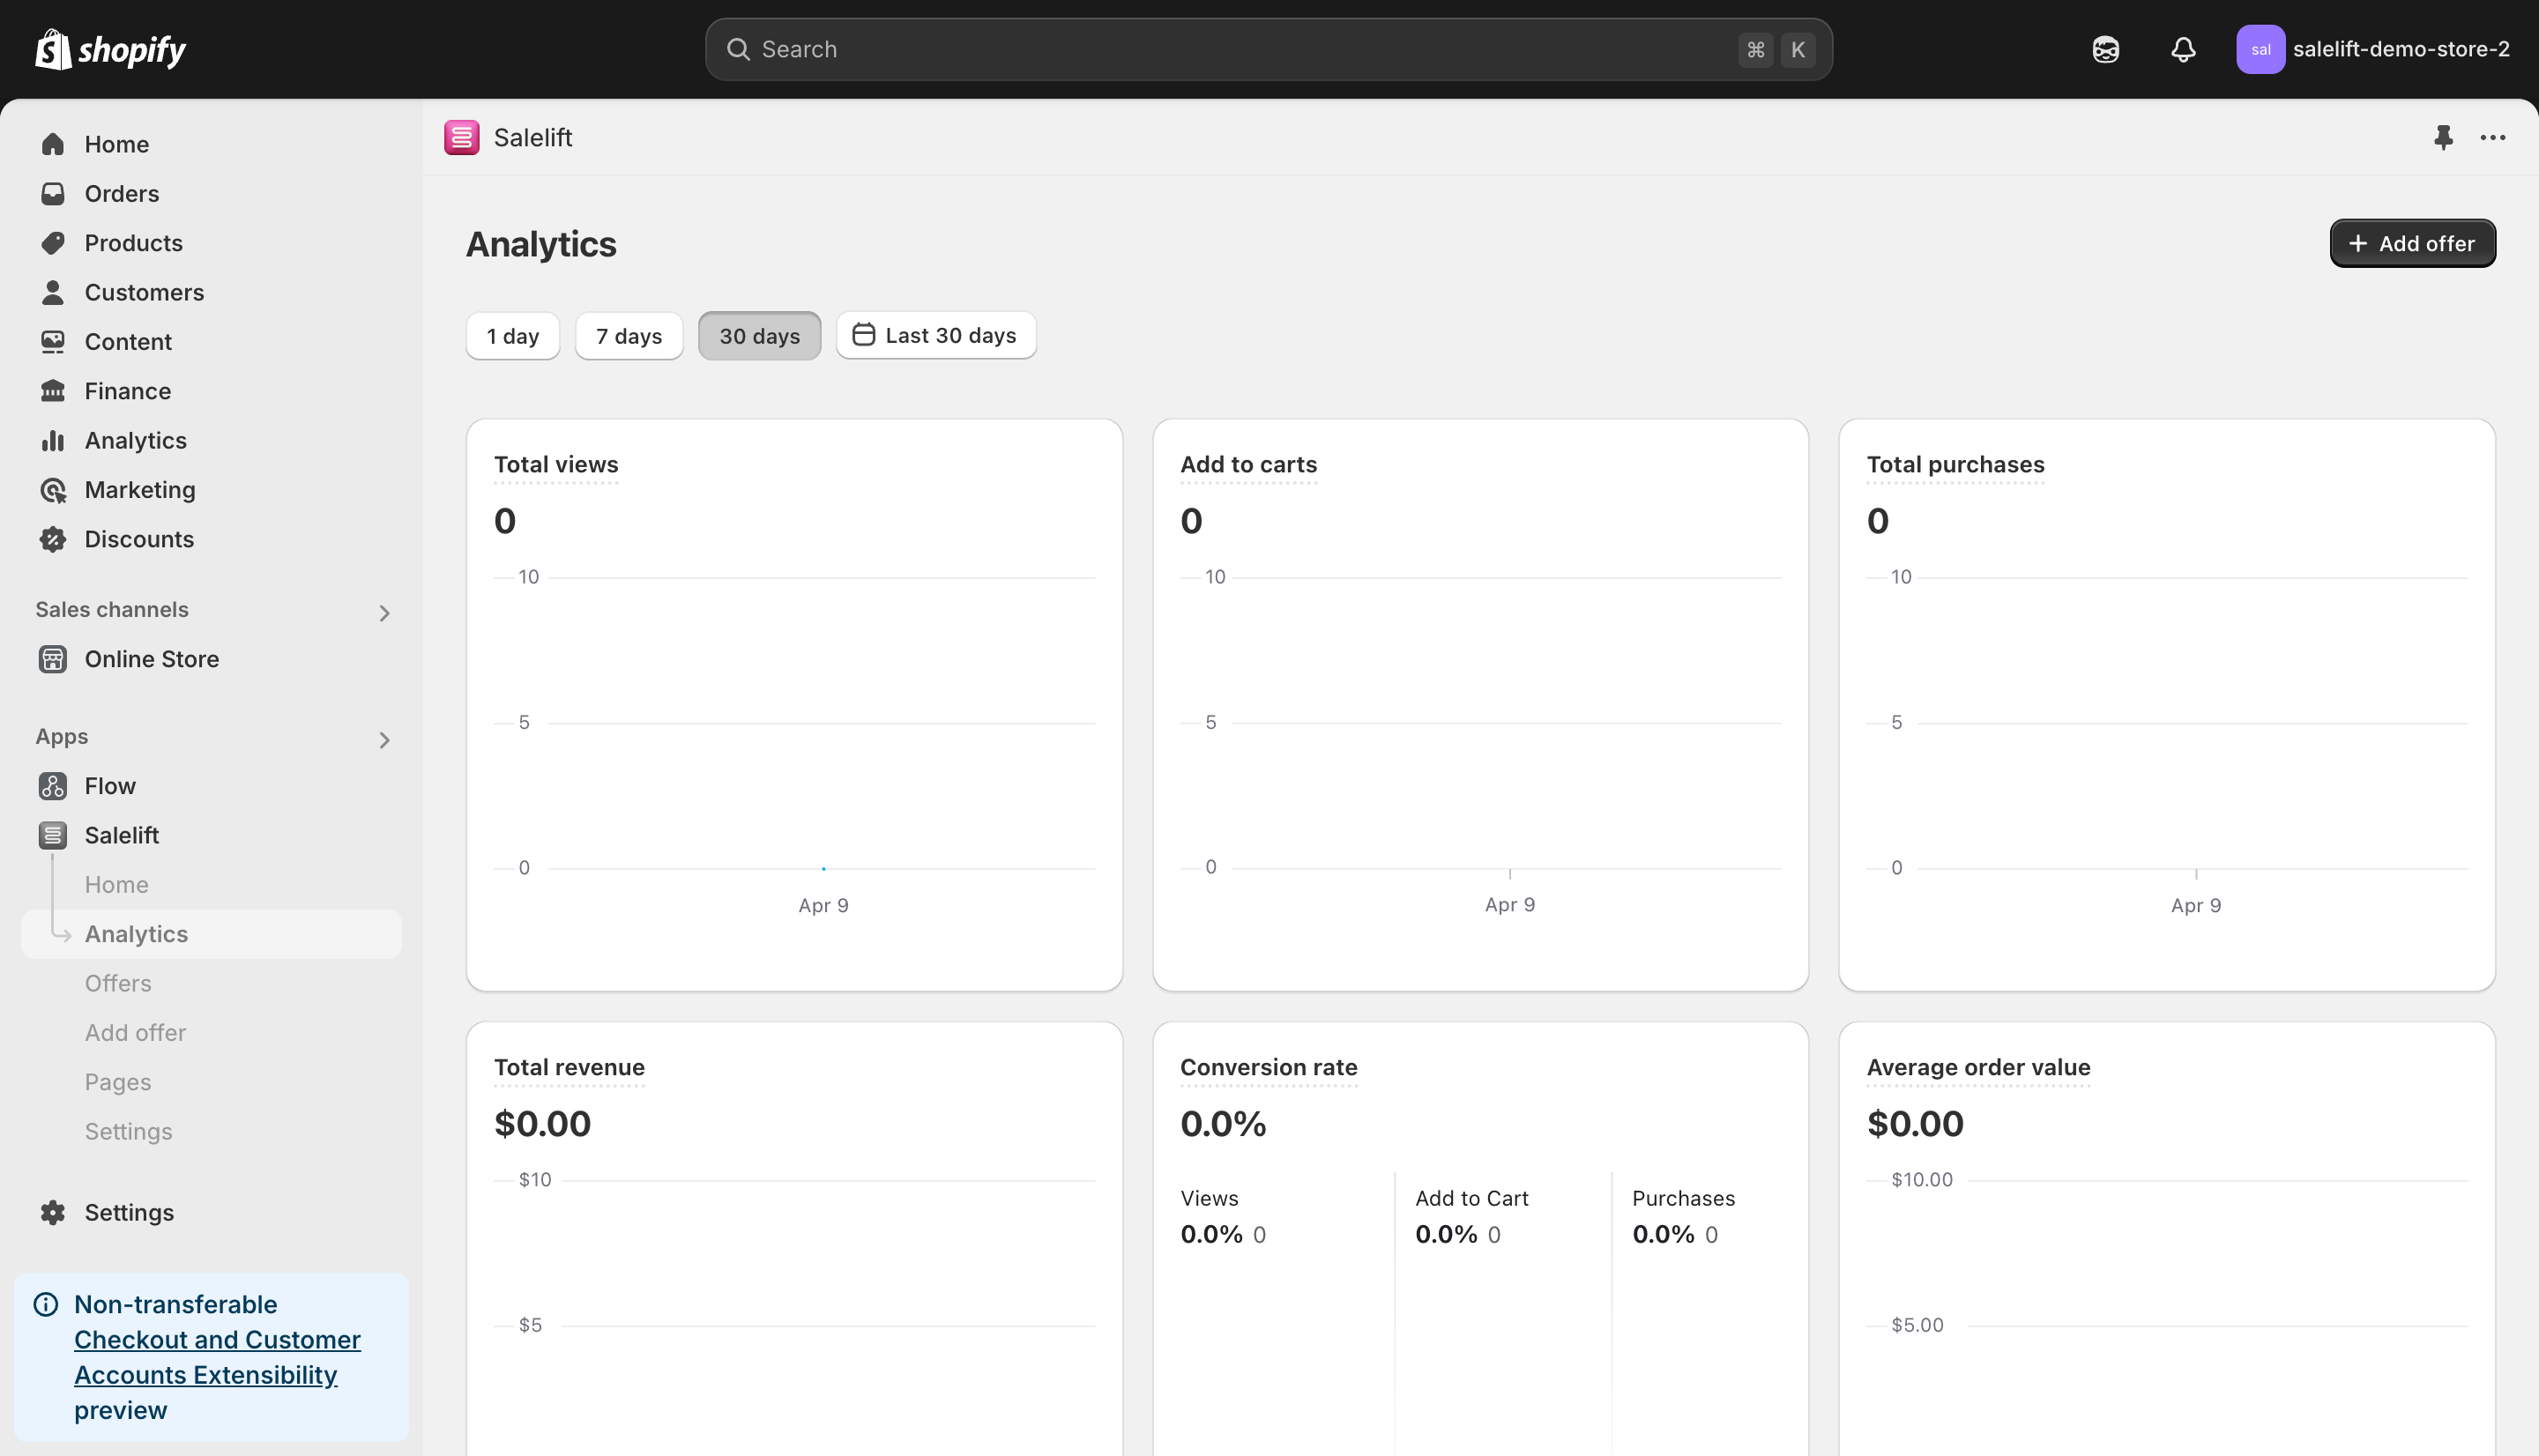
Salelift provides comprehensive analytics to help you track the performance of your offers and make data-driven decisions to optimize your strategy.
Accessing Analytics
- Log in to your Salelift dashboard
- Click on "Analytics" in the left sidebar menu
- You'll see an overview of your offer performance metrics
Key Performance Metrics
Salelift tracks several important metrics to help you understand how your offers are performing:
Viewing Data
Total Views
- Measures how many times your offers have been viewed by customers
- High view counts with low conversions may indicate the offer isn't compelling enough
Add to Carts
- Tracks how many times products from your offers were added to shopping carts
- Indicates initial customer interest in your offers
Total Purchases
- Shows the number of successful conversions from your offers
- The ultimate measure of offer effectiveness
Financial Impact
Total Revenue
- The total monetary value generated by your offers
- Helps you understand the direct financial impact of your Salelift implementation
Average Order Value
- The average amount spent per order when customers accept your offers
- Higher average order values indicate successful upselling/cross-selling
Performance Ratios
Conversion Rate
- The percentage of customers who purchase after viewing your offers
- Broken down into:
- Views to Add to Cart conversion
- Add to Cart to Purchase conversion
- Overall Views to Purchase conversion
Filtering and Analyzing Data
Time Period Selection
Customize your analytics view by selecting different time periods:
- 1 day (for immediate impact analysis)
- 7 days (for weekly performance trends)
- 30 days (for monthly performance assessment)
- Custom date range (for specific campaign analysis)
Analyzing Specific Offers
For deeper insights into individual offer performance:
- Navigate to the specific offer from the Offers section
- View the offer-specific analytics dashboard
- Compare performance across different offers to identify your most effective strategies
Interpreting Analytics Data
Understanding View-to-Purchase Funnel
The customer journey typically follows this path:
- View the offer
- Add to cart
- Complete purchase
Identifying where customers drop off in this funnel can help you optimize:
- If views are high but add-to-carts are low: Improve the offer's appeal or presentation
- If add-to-carts are high but purchases are low: Examine checkout friction or price perception
Benchmarking Performance
Compare your metrics against:
- Your previous performance periods
- Industry standards (average e-commerce conversion rates are typically 2-3%)
- Your specific store's baseline conversion rate without offers
Optimizing Based on Analytics
Future A/B Testing Capabilities (Coming Soon)
We're working on bringing you powerful A/B testing features that will allow you to:
- Create and compare different offer variations
- Test different variables systematically
- Make data-driven decisions based on statistical significance
- Implement winning strategies automatically
In the meantime, you can optimize your offers by:
- Monitoring performance metrics for different offer types
- Comparing success rates across different placements
- Tracking which product combinations perform best
- Using customer feedback and engagement data
Optimizing Placement
Analytics can reveal which placement positions perform best:
- Product page offers: Check if specific product pages convert better than others
- Cart offers: Compare performance against checkout or post-purchase offers
- Time-based offers: Analyze if limited-time offers outperform standard ones
Pricing Strategy Optimization
Use revenue and conversion data to refine your pricing approach:
- If conversion rates are low, consider more attractive pricing or bundling
- If average order value is high but conversions are low, you might be targeting the right customers but pricing too high
Reporting and Exporting Data
Regular Performance Reviews
Establish a routine for reviewing your Salelift analytics:
- Weekly quick checks for immediate optimization opportunities
- Monthly deep dives for strategic adjustments
- Quarterly reviews for long-term planning
Sharing Insights
When working with a team:
- Screenshot or export key metrics for team meetings
- Focus on actionable insights rather than raw data
- Connect Salelift performance to overall store metrics
Using AI for Analytics Insights
Salelift's AI capabilities can help interpret your data:
- Identify patterns in customer behavior
- Suggest optimization opportunities
- Predict which offers are most likely to succeed based on historical data
By regularly reviewing your analytics and making data-driven decisions, you can continuously improve your offer strategy and maximize the ROI from your Salelift implementation.